Who Counts as Asian
CHALLENGE
As part of Asian American Politics taught by Dr. Janelle Wong at the University of Maryland at College Park, students communicate course content thoughtfully through creative projects.
OBJECTIVE
Through review and research based on course content, I conceptualized and sketched a solution and completed the design and layout of an information graphic.
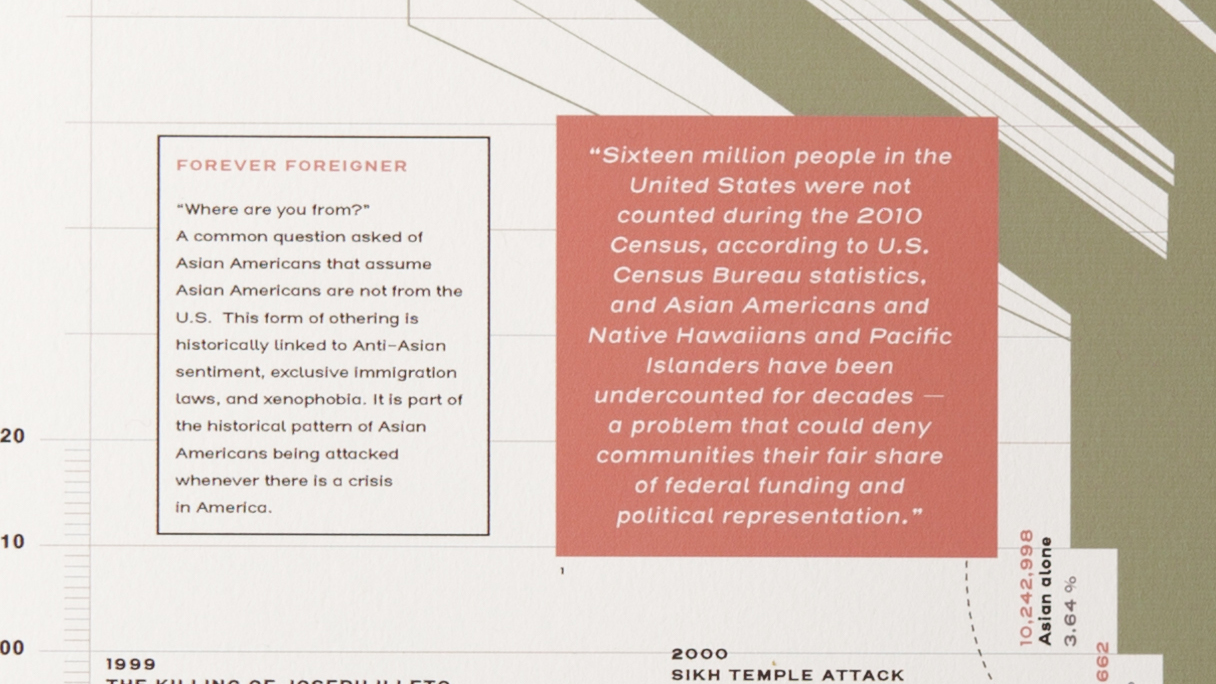
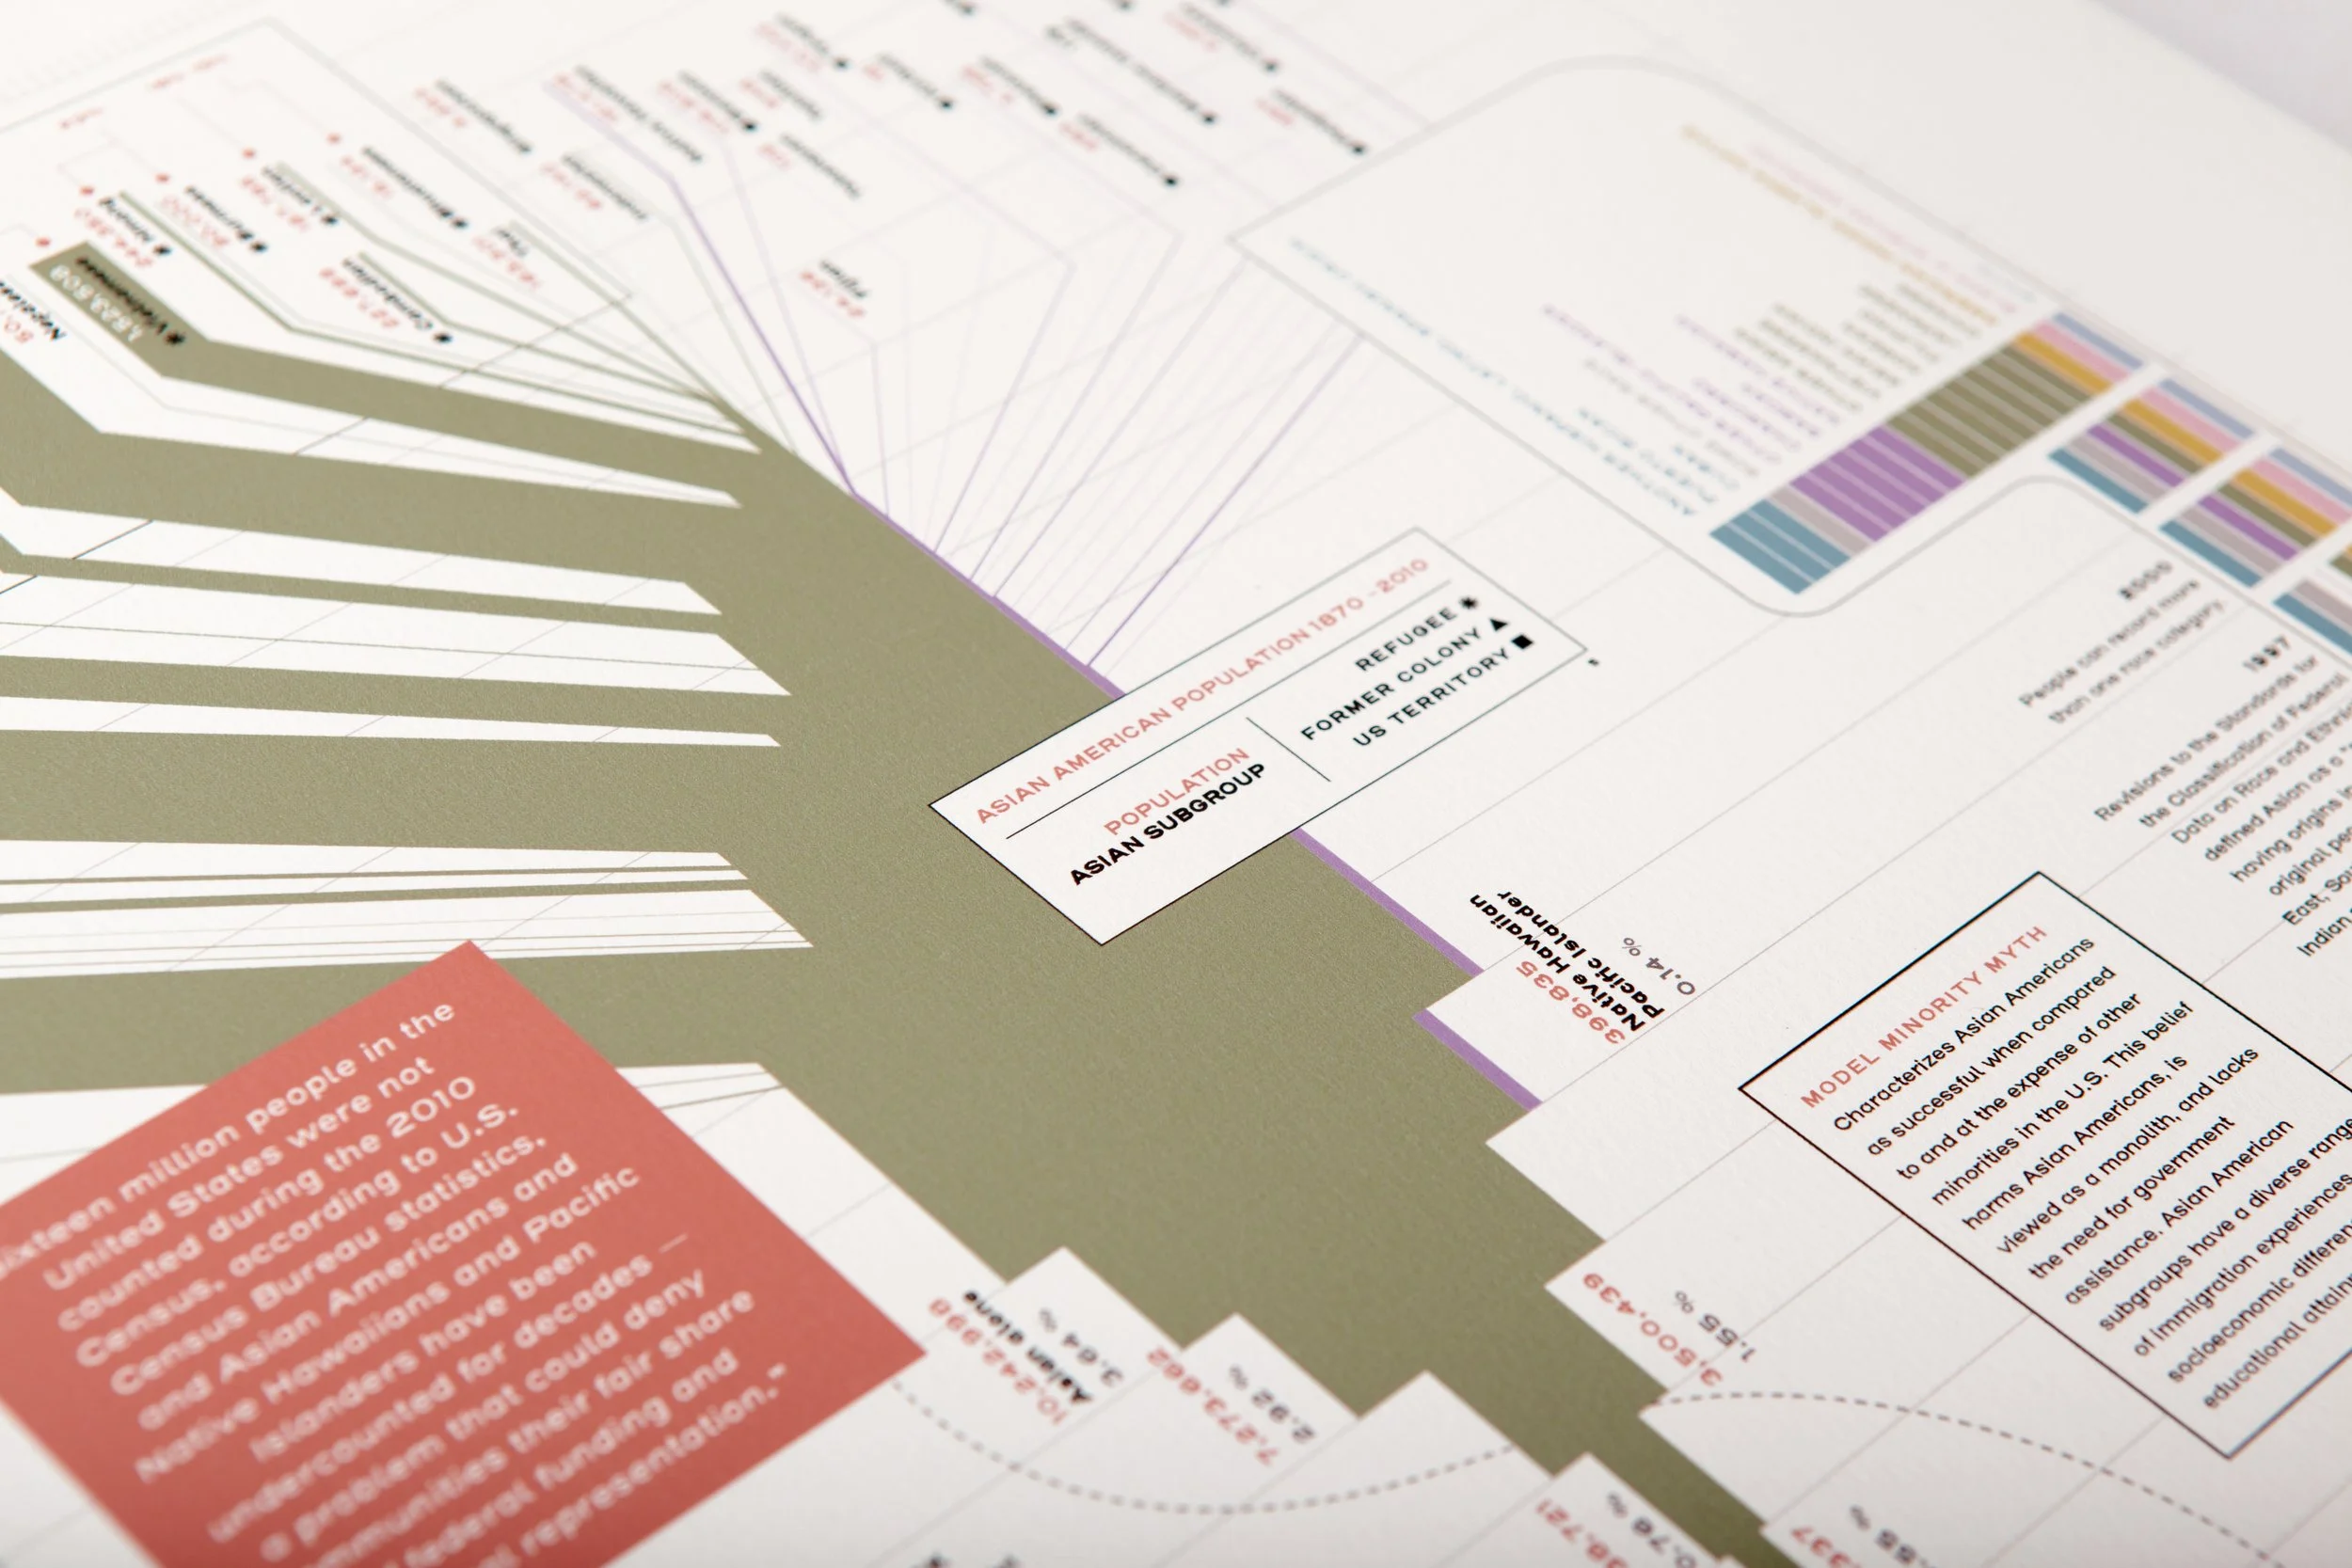
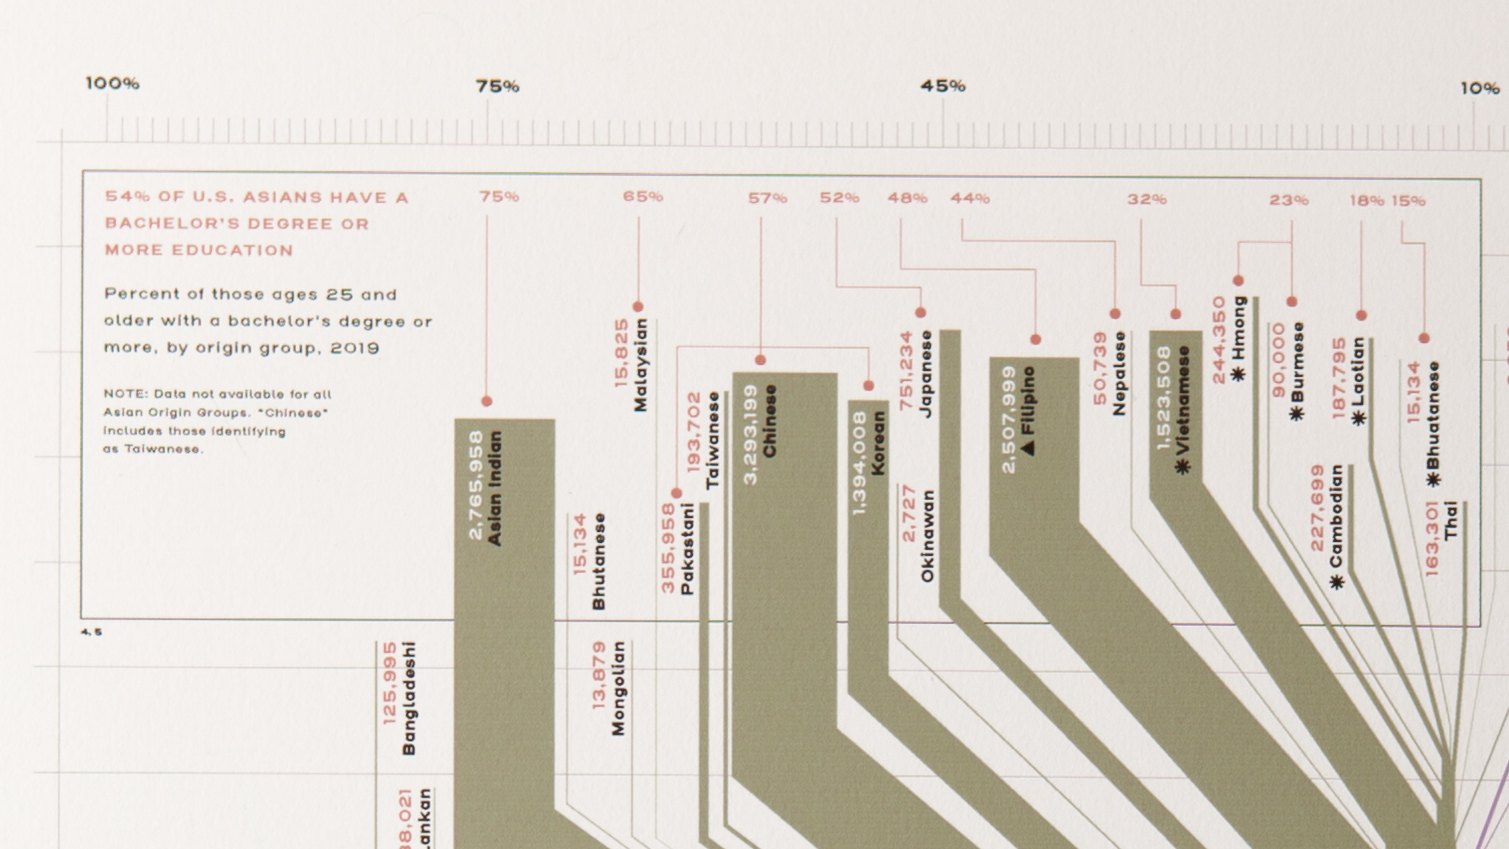
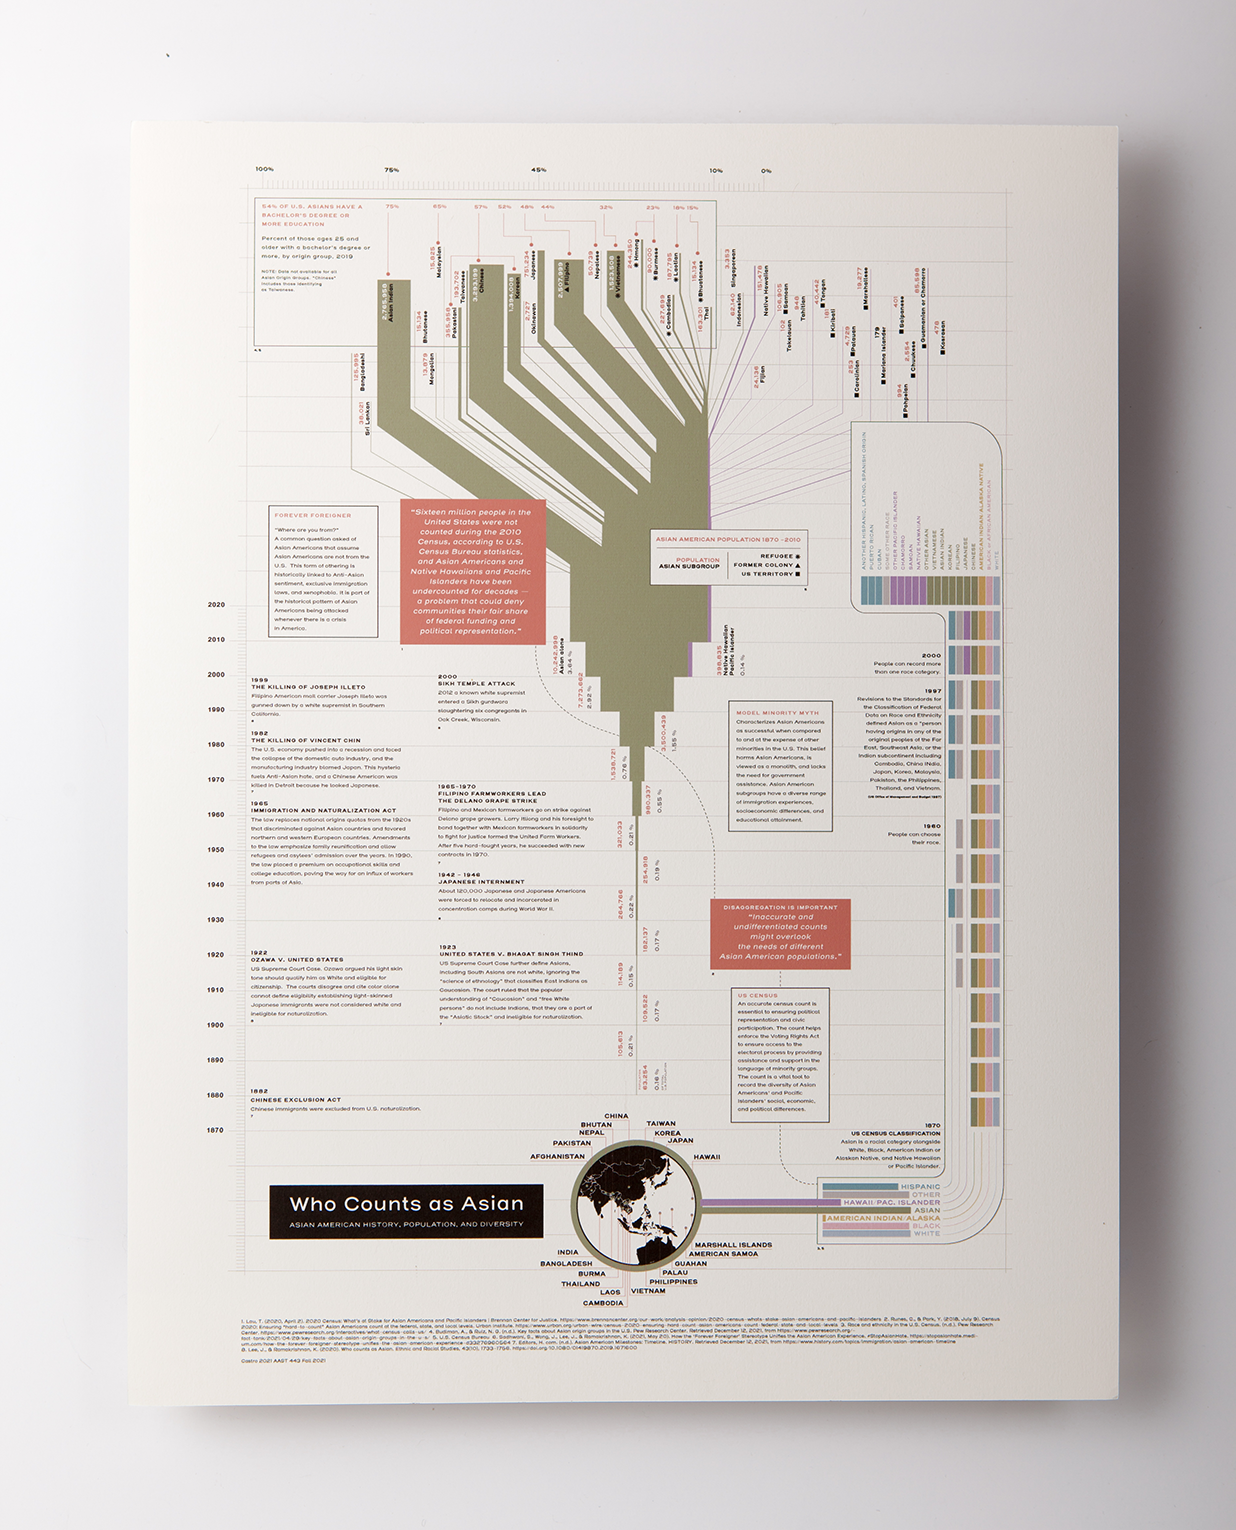
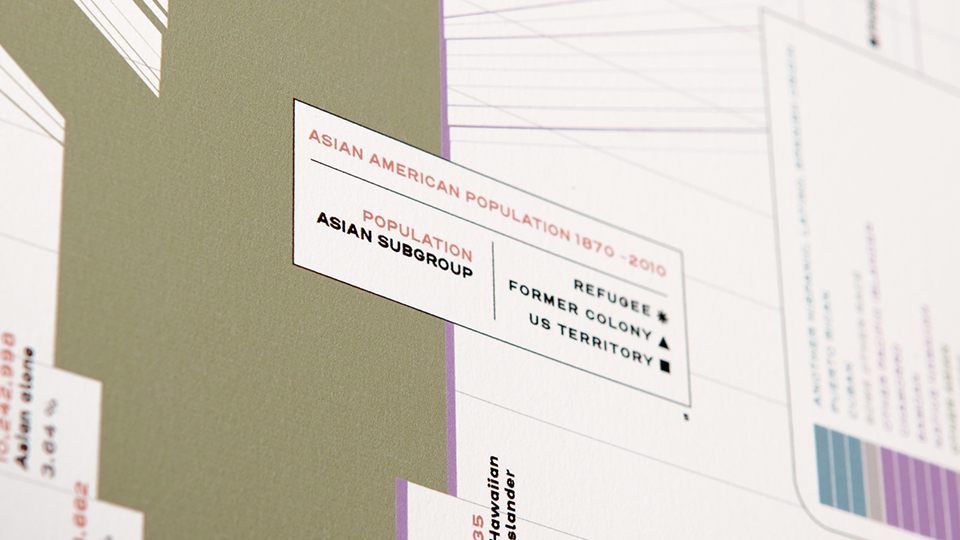
According to the U.S. Census, the information graphic reveals America’s racial makeup and population as it begins counting Asians in 1870. The Asian American people, as tabulated by the U.S. Census, is visualized as a tree with many many branches to recognize the many subgroups that make up the moniker “Asian American.” The graphic also shows varying levels of educational attainment among Asian American subgroups to balance against the model minority myth used at the expense of other minority groups. All of the data accompany historical events that show the treatment of Asians and the continuing problem with the Forever Foreigner stereotype.
RESULT
The project successfully communicated essential aspects of the Asian American population, the importance of U.S. Census data, and the diversity of Asian Americans.
The Asian American experience varies along with the socioeconomic status and immigration experiences shaped by imperialism and capitalism. Through the labor needs of business and government legislation, Asian Americans have experienced the pull of opportunity throughout history from immigration for laboring on the railroads, farming, and today’s demand in the technology sector.
TYPE
Infographic
ROLE
Research
Concept
Design
Layout
CREDITS
Janelle Wong, PhD